Encoding multiple dimensions in a static image
I wrote this script while I was in graduate school, studying the effect of astrocytic calcium waves on blood vessels. The project involved taking a lot of time-lapse images to study both the changes in activity and changes in the vasculature.
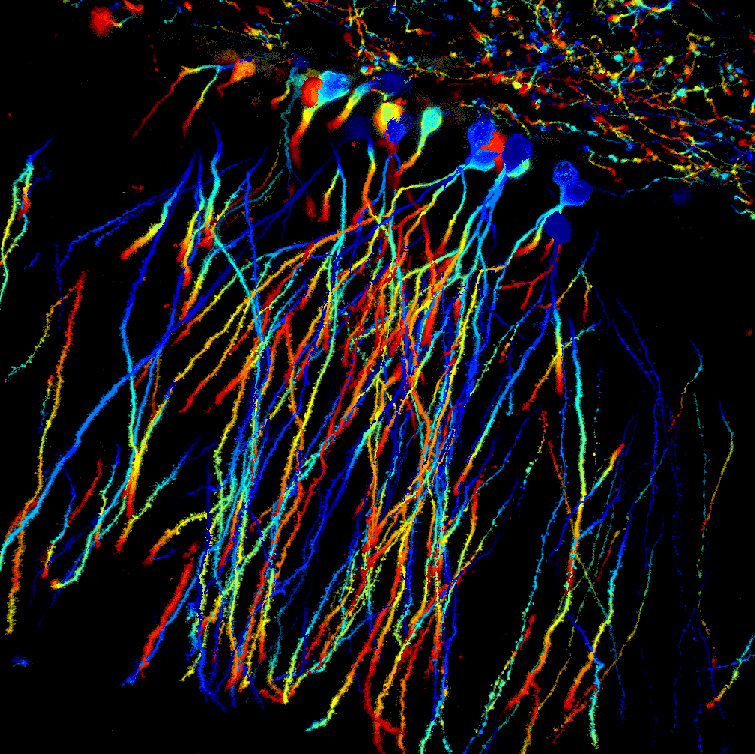
I looked at a lot of time-lapse images trying to see patterns of activity. I would play them in various ways–clicking through them one-by-one, playing them at different speeds in a movie, watching the images backwards, etc. One day I attended a talk where someone encoded three different time points red, blue, and green. I though, “What if you apply the same idea on calcium waves but use more time points and more colors?” That’s what I did with this project. One example is shown in the first figure here.
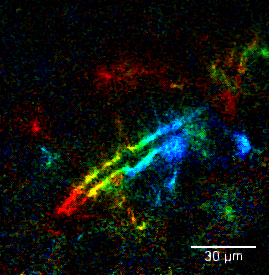
The strategy to encode color based on image series position was the following. For each pixel, I would determine the average signal intensity across the image series. Then I would define a threshold for which to assign that pixel a color value (as shown in the second figure). This threshold would be above the average, either a percent change or relative to the standard deviation. The idea is that the first time the pixel reaches signal at its threshold, it will be assigned the color that maps to that point in the image series. The pixels would then get merged to produce the resulting images.
When paired with a scale bar, it was easy to tell things like how fast the wave moved and how far it traveled. I thought it was a cool way to show dynamic things in a static image and so I therefore applied it to other examples. It wasn’t long before I realized it can be applied to a different kind of image series, one where the represented dimension was depth instead of time. One such example is on the home page.
The MATLAB code for this script can be found on my Github page here.