Schools overcoming circumstances
Since I’m interested in education as a driver of societal change, I wondered what schools are doing well in the face of apparently adverse circumstances. Therefore, I explored trends of high school student dropout data from 2015-16 which is available from the California Department of Education website. I also obtained supplementary information from the United States Census Bureau.
Most of what I have revealed in this is not novel nor unexpected. In fact, not long after I embarked on this personal project, I saw that kidsdata.org had performed similar analysis with the data. This was not necessarily a bad thing since I was able to use their work as a sanity check for some of the analysis that I did.
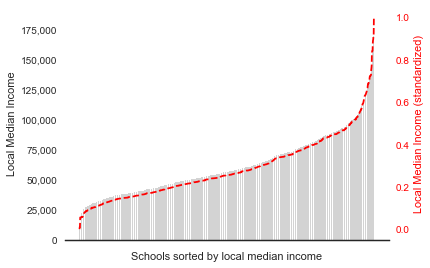
Nevertheless, exploring the data myself allowed me to hone in on my question. To start, I made some assumptions and decisions on the scope of the study. First, I chose to limit my analysis to high schools that had at least 25 students each in grades 9-12. Therefore, high schools that did not have a 9th grade or schools that had a very small number of students were filtered out. In total, there remained 1,804,448 students from 1,352 schools on which to do the analysis. It was also important to me to include economic characteristics of each school. However, I could not find school-specific information on income. Instead, I used the census data which provides median income by zip code as a proxy. Therefore, two high schools within the same zip code could have students from different median income levels, but they would be represented by the same median income in the study. It is my assumption that this situation does not occur often but it is a caveat worth noting. (While investigating the diversity of income levels, it was eye-opening to see the inequity in wealth distribution.)
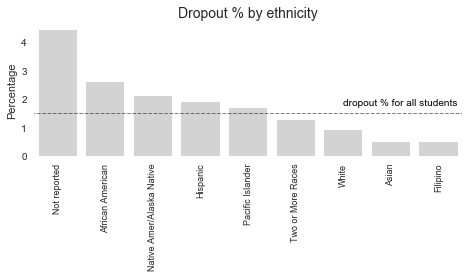

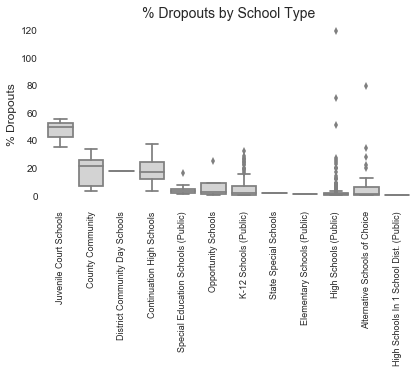
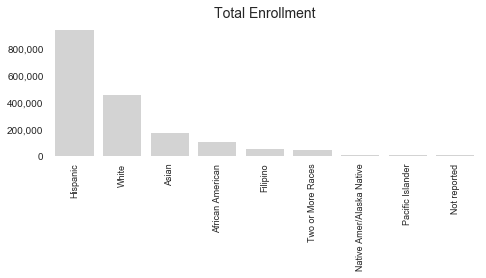
The figures in the gallery are a sampling of the project. The first figure shows dropout percentage by ethnicity. Statewide, the dropout percentage for all students is ~1.5%. However, minorities such as African-Americans, Hispanics, and Native American and Alaska Natives are dropping out at a rate higher than this. Interestingly, the students who chose not to report their ethnicity showed a far higher rate of dropping out than any other category. However, when looking at total enrollment, the “Not reported” category of students is very small relative to the others. The second figure highlights dropout rate percentage by local school median income. Schools located in the poorest areas are the most at-risk for having a high dropout percentage. The dataset also allowed for looking at dropouts by school type, which is something that I had not initially thought to investigate. The vast majority (94.2%) of CA high school students are enrolled in public high schools, of which a very high proportion show very low dropout rates. On the other hand, juvenile court schools and county community schools show very high dropout rates. (I just happened to catch up with a high school friend recently who teaches at a juvenile court school. He gave me some insight into some of the challenges there.)
Importantly, there are many school factors that counteract apparent trends in dropout rates. What is particularly encouraging is the high number of schools that seem “at-risk” yet have low dropout rates. For example, in the figure showing dropout rate by local median income, half of the schools that are in the poorest areas of California still have dropout rates in the low single digits. One such school is Stockton Collegiate International Secondary School, which resides in a zip code with a local median income of $14,579 and yet has only 0.42% of students dropping out. Not surprisingly, they have earned accolades in US News & World Report according to their website.
A basic mission of our school system is to see that all students graduate high school and avoid dropping out. Students who drop out face significant life challenges, including lower wages and higher incarceration rates. However, the factors that influence a school’s dropout rate are numerous and complex. The purpose of this data science project was to explore and identify features that could contribute to high dropout rate and find schools that have low dropout rates. Studying schools like Stockton Collegiate and performing additional analysis about them could help reveal factors that facilitate student success in challenging circumstances.
For this project, my code and additional figures can be found in a Jupyter notebook on my Github page here.